Oucome of the Big Plastic Count
During the week of the tracking exercise, It was interesting to see how every member of the household became a participant. Each one of us interpreted categories differently, and on many occasions, when one of us wanted to add an item to its respective category, we found ourselves wondering which one would be the best option. For convenience, not all items were 100% placed in the right category, although before submitting the count, I double-checked and organized the items again, and tried to place them in the right category.
The idea of doing this exercise was to, just like using an app, use the tools that were given to us to register information for citizen-powered research. The method for collecting information was the Tally sheet, which was manual and required the users (us) to frequently double-check the category of every item. The principle of the Tally Sheet and the beach survey ‘data card’ are in essence very similar. They are based on an individual’s observations and subject to their interpretations.
After the count had been done, the participants were prompted to submit their data online. The interface resembled the Tally Sheet and all the visuals that were presented in it were the same.
After entering the corresponding amounts, I was given a household plastic footprint. This was subject to the number of adults and children living in the house. This plastic footprint consisted of two interesting pieces of information:
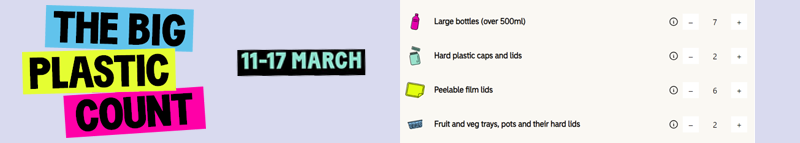
- The number of plastic pieces that we used in a week: This was further supported by ‘relatable numbers’ or rather, numbers that are presented through a statement that makes sense to people.
- A breakdown of the plastic elements collected in the household: This was presented as percentages and supported with images.
Finally, the results of this research will be published in April 2024, but taking on the experience helped me to understand the challenges of people-powered research and the impact on data quality.